01 / AVEOUTPUT STRUCTURE
Commit to visual evidence
Build each anchor as a region–attribute–slot triple. Locate the region before extracting the attribute so each step has a checkable spatial commitment.
November 10–14, 2026 · Rio de Janeiro, Brazil
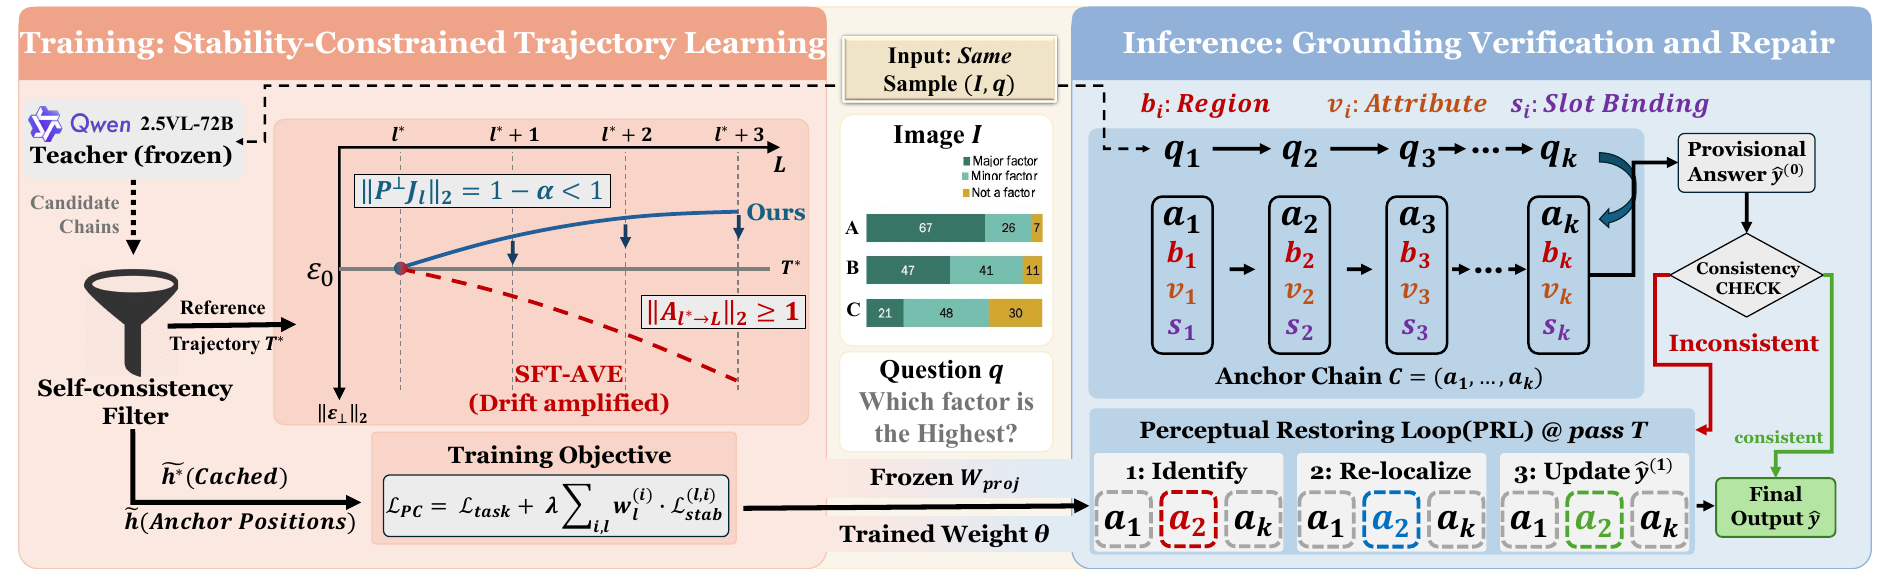
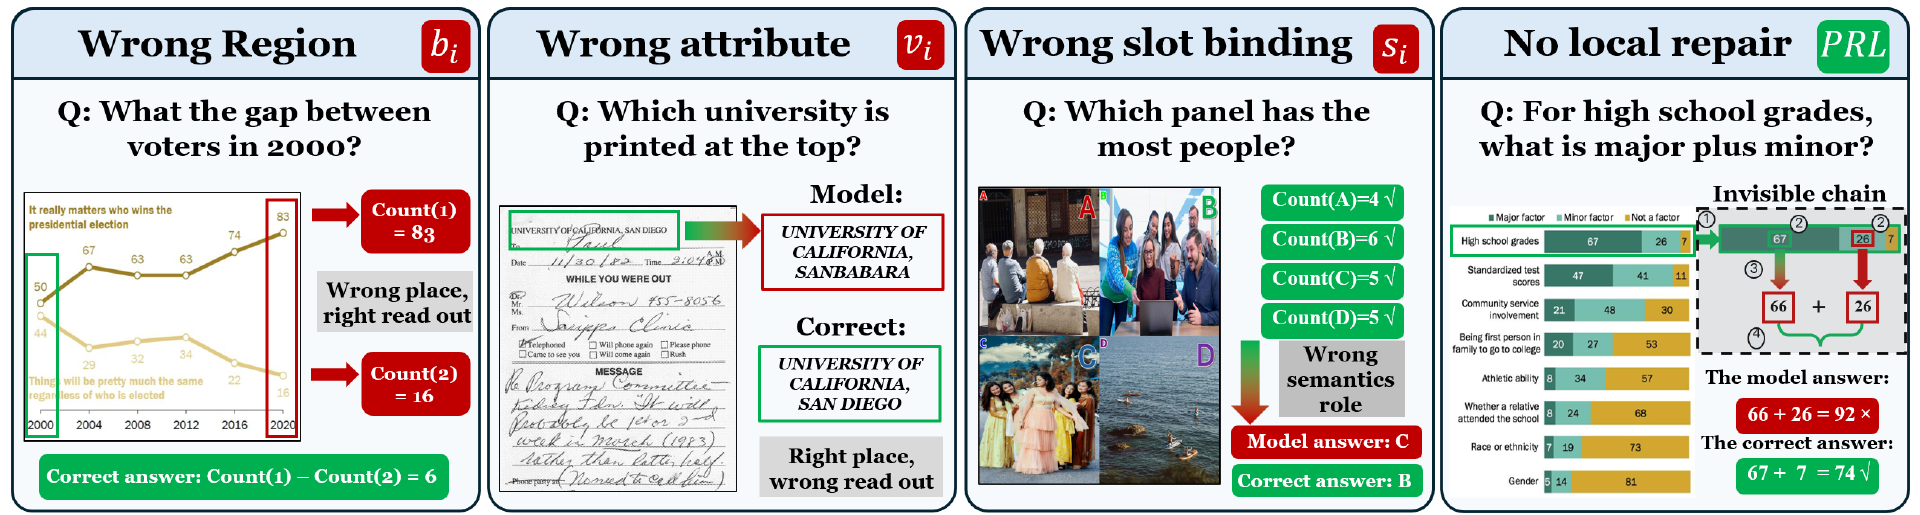
Multimodal chain-of-thought methods produce textual reasoning steps, but the visual grounding underlying each step is never made explicit. When a model attends to the wrong region, nothing in the chain records this: the error is unverifiable during inference, unlocalizable after the fact, and uncorrectable without regenerating the entire chain. We propose Perception Chains, which treats each reasoning step as a grounding commitment: before drawing any conclusion, the model must name a region, extract an attribute from that region, and assign it to a reasoning slot. With this structure in place, every grounding decision is independently checkable and a wrong answer is traceable to the step where the binding failed. Correct output format, however, is not sufficient. A model satisfying the format can still leave its hidden states at anchor positions in a non-attenuating drift regime. Across our measured settings, task-loss gradients are nearly orthogonal to the stability objective at these positions, and standard fine-tuning does not eliminate the drift. A stability loss directly constrains this geometry and enforces transversal contraction. High-quality reference trajectories are constructed without human annotation by retaining only chains where independent samples from a frozen 72B VLM converge, filtering at the anchor level rather than by answer correctness alone. At inference time, a consistency check identifies anchors whose evidence conflicts with the provisional answer; only those anchors are re-localized before the final answer is committed. On eight benchmarks against six baselines, Perception Chains achieves the highest average accuracy, with the largest gains on tasks requiring precise region-attribute binding. On DIOR-RSVG, grounding accuracy rises from 61.7% to 72.6% over the strongest spatial baseline. The stability loss, not the anchor format, is the transferable component: gains carry to seven held-out benchmarks unseen during training.
Four complementary components connect visible evidence, representation stability, and targeted correction.
Build each anchor as a region–attribute–slot triple. Locate the region before extracting the attribute so each step has a checkable spatial commitment.
Penalize deviations perpendicular to the reference reasoning direction. The objective targets anchor representations that format-only supervision leaves unconstrained.
Use agreement between independently sampled chains from a frozen 72B teacher to filter reference trajectories at the anchor level, without additional human annotation.
Check evidence against the provisional answer, re-localize the conflicting anchors, and update the answer. The teacher is absent during inference.
Evaluated on eight seen benchmarks and seven held-out benchmarks, with controlled comparisons on a shared 7B backbone.
DIOR-RSVG grounding accuracy
72.6% vs. 61.7% · Ferret baselinePOPE hallucination rate
Down from 12.8% · vanilla backboneSeen and unseen benchmarks
Qwen2.5-VL-7B backbone+9.2 percentage points over the same anchor format without the stability loss. Source: Tables 2 and 4.
FORMAT ALONE IS NOT ENOUGH
SFT-AVE
Perception Chains
Fraction of 1,000 calibration inputs with a composite operator norm above 1, indicating non-attenuating drift. Source: Table 5.
↑ Higher is better · ↓ Lower is better · — Not applicable
| Method | ChartQA ↑ | DocVQA ↑ | RSVQA ↑ | DIOR-RSVG ↑ | MuMuQA ↑ | MMIU ↑ | POPE HR ↓ | HallusionBench HR ↓ |
|---|---|---|---|---|---|---|---|---|
| Vanilla Qwen2.5-VL-7B | 88.6 | 95.9 | 87.4 | — | 66.8 | 57.9 | 12.8 | 47.1 |
| Visual CoT | 88.8 | 95.6 | 87.6 | — | 67.2 | 58.1 | 12.2 | 45.8 |
| Ferret | 88.7 | 95.5 | 88.7 | 61.7 | 68.8 | 59.6 | 11.2 | 44.8 |
| TPO | 88.4 | 95.7 | 87.3 | — | 66.7 | 57.8 | 9.2 | 33.2 |
| Woodpecker | 88.6 | 95.9 | 87.4 | — | 66.8 | 57.9 | 9.8 | 45.8 |
| SFT-AVE | 89.8 | 96.2 | 89.5 | 63.4 | 71.2 | 61.5 | 10.2 | 43.1 |
| Without AVE | 88.1 | 95.4 | 87.2 | — | 66.3 | 57.6 | 11.6 | 46.2 |
| Perception ChainsOURS | 91.4 | 96.8 | 92.6 | 72.6 | 74.3 | 64.8 | 7.3 | 31.8 |
Table 2 · Means from the paper; reported uncertainty is available in the PDF. ChartQA uses relaxed accuracy (±5%), DocVQA uses ANLS, and DIOR-RSVG uses accuracy at IoU ≥ 0.5. POPE HR is 1 − F1. HallusionBench is distinct from the Object HalBench benchmark in the unseen split.
Evaluation setting. Training-time baselines are reimplemented on Qwen2.5-VL-7B with the same balanced 100,000-example training mixture and schedule. Woodpecker is applied post hoc. Scores describe this controlled comparison, rather than the original baseline releases.
At the default setting, PRL triggers on 17.8% of samples and total inference overhead is 1.50× vanilla. A threshold of 0.5 reduces overhead to 1.31×, with 72.1% grounding accuracy. Table 10.
An internally consistent but wrong chain can evade the check. Missed regions, plausible numerical errors, and some incorrect slot bindings remain possible. Sections 2 and 6.
@inproceedings{zuo2026perceptionchains,
  author    = {Zuo, Dongqi and Guo, Weixing and Wang, Xinyu},
  title     = {Perception Chains: Stabilizing Multimodal Reasoning
               with Explicit Visual Intermediates},
  booktitle = {Proceedings of the 34th ACM International
               Conference on Multimedia},
  series    = {MM '26},
  year      = {2026},
  publisher = {Association for Computing Machinery},
  address   = {New York, NY, USA},
  location  = {Rio de Janeiro, Brazil},
  numpages  = {9},
  doi       = {10.1145/3767308.3836512},
  url       = {https://doi.org/10.1145/3767308.3836512}
}